Output data
Outputs all resulting directories, files, and figures to directory specified as the workingDir when creating an instance of class Analysis.
It will also output an analysis report detailing all results and figures.
Directories
These subdirectories are created and:
Contains a folder for each individual bootstrap experiment which includes:
Files |
Description |
|---|---|
batches.txt |
List of batches used in the analysis |
comparison.xlsx |
Evolutionary conservation file |
dendrogram-heatmap-correlation-data.(h5/xlsx) |
For each gene holds all measurement data (e.g. cluster, Fraction, Top50 overlap, etc.). Contains correlation distance of expression measure. |
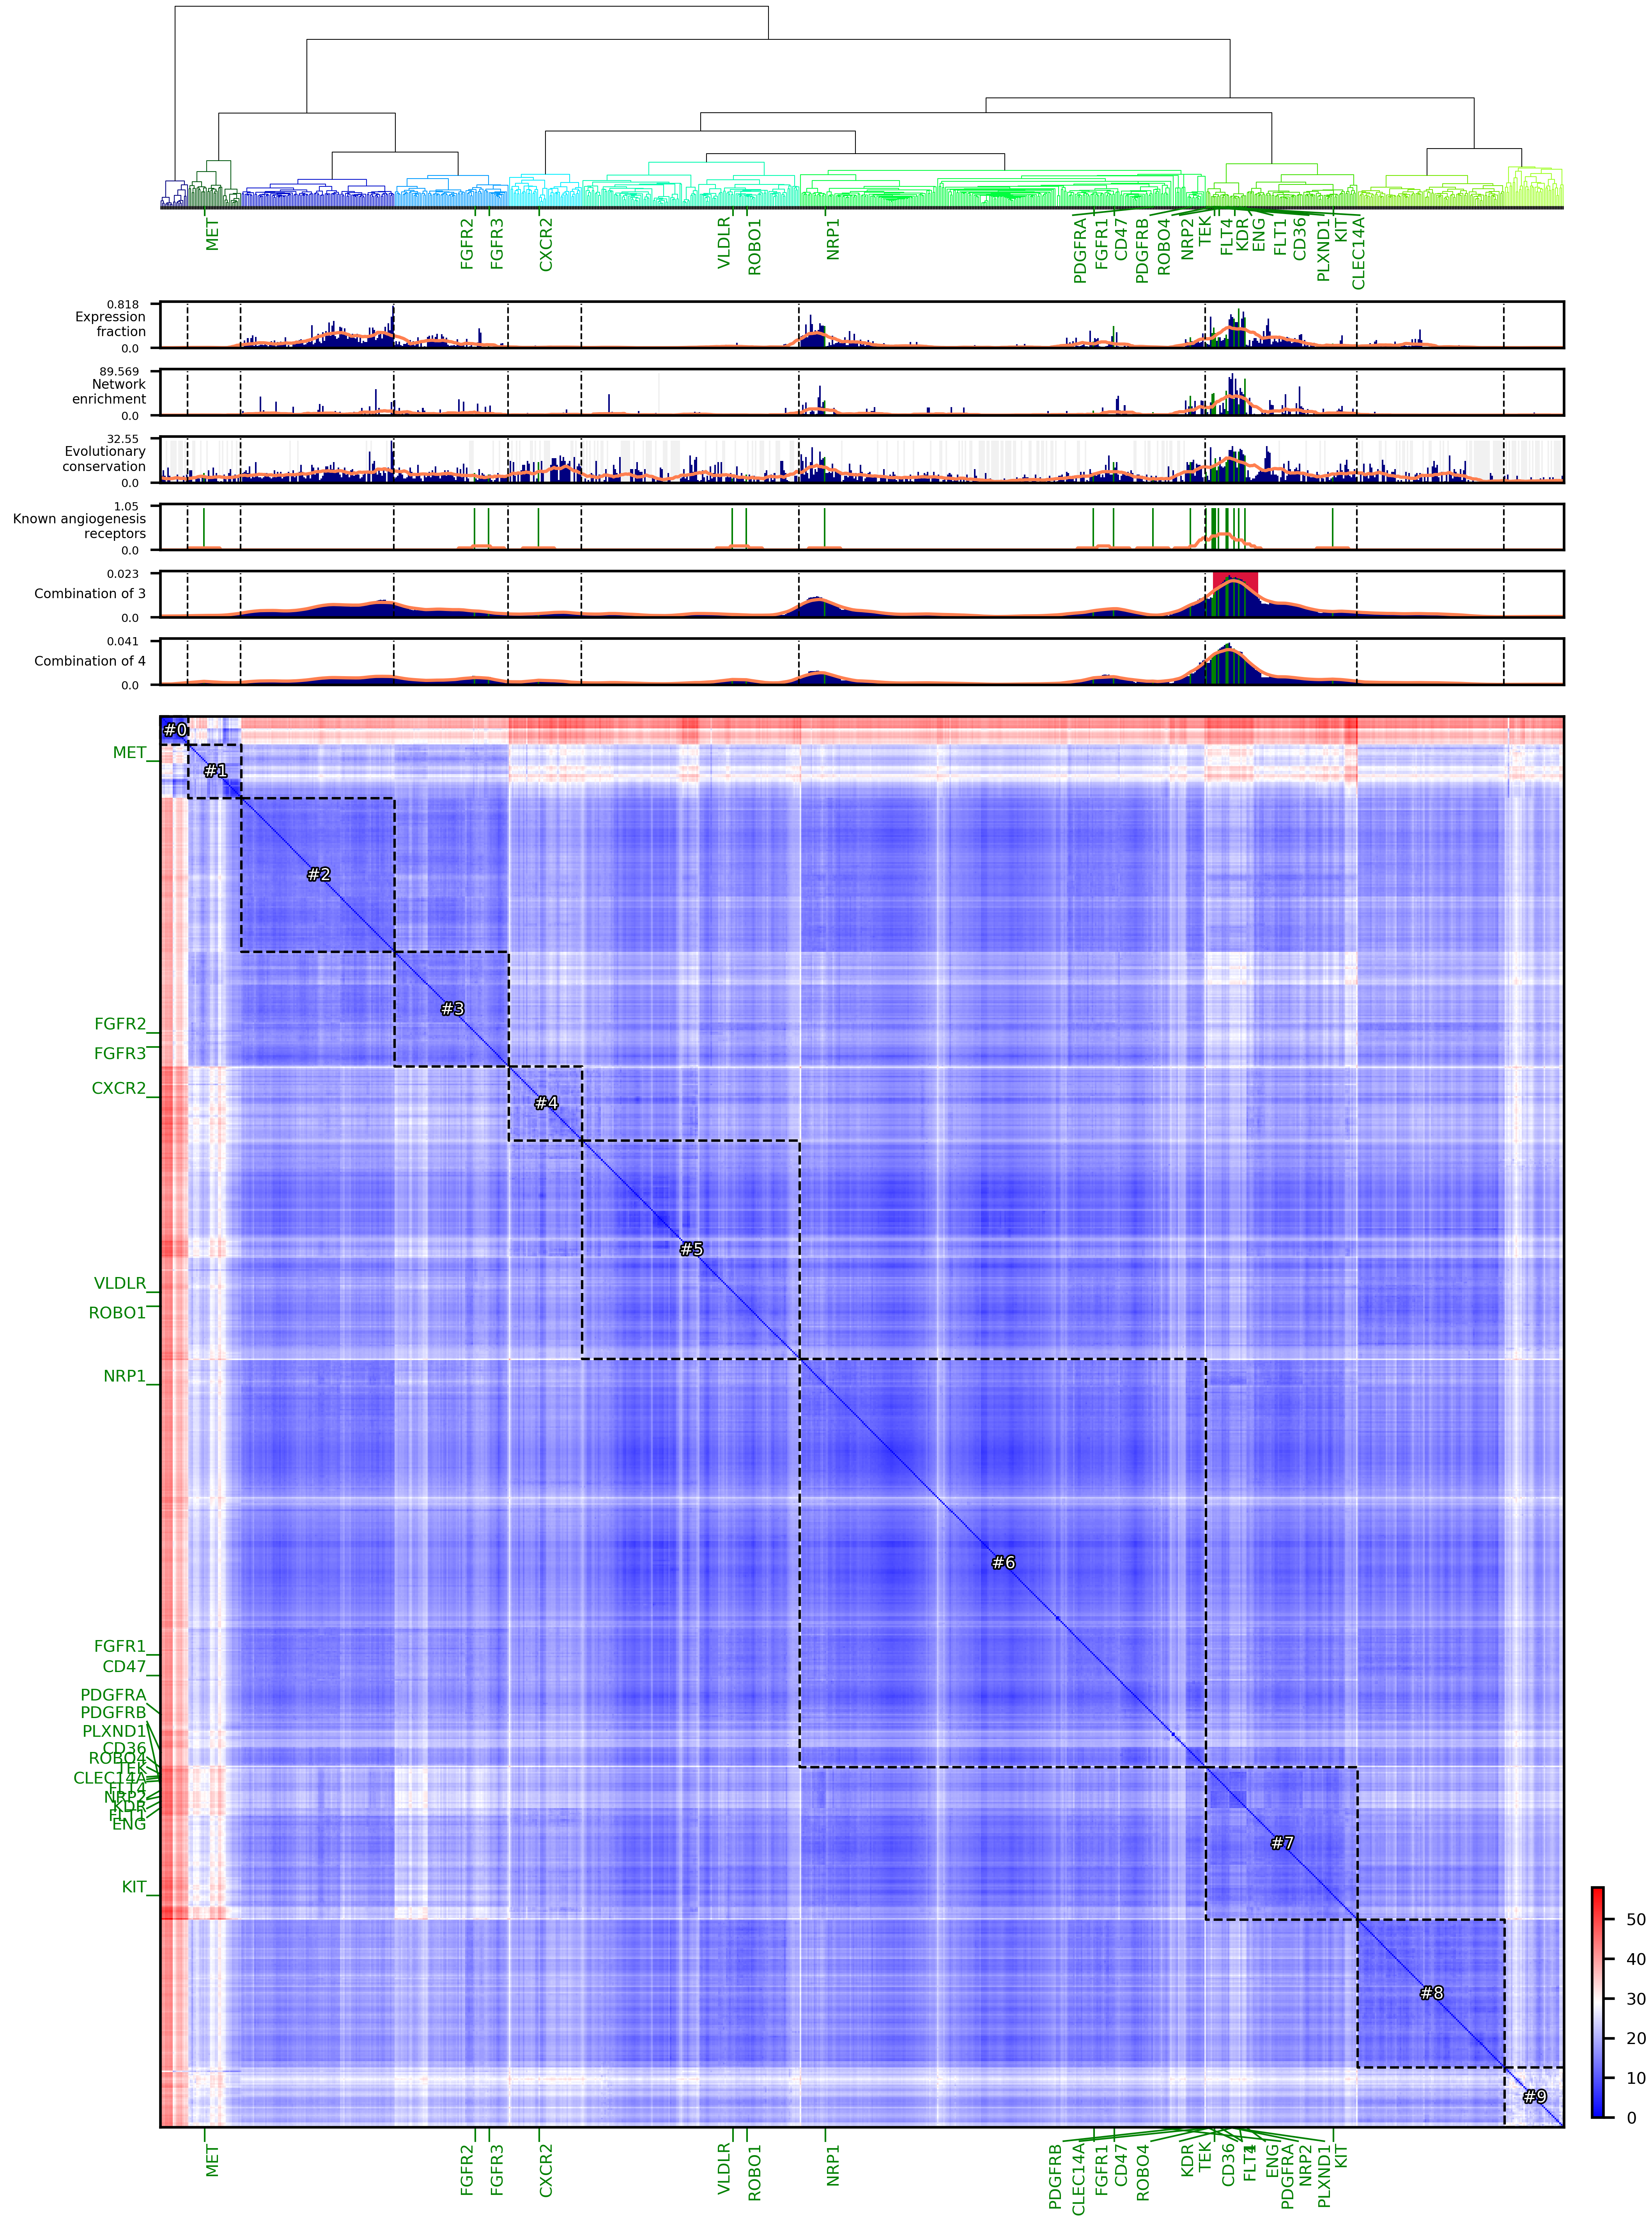
dendrogram-heatmap-correlation.png |
Saved dendrogram, heatmap, and bargraphs, see example below |
metricFile.h5 |
Gene expression data for specified metric |
per-gene-measures-correlation.(h5 & xlsx) |
Intra-measures from each gene |
perGeneStats.h5 |
For each gene holds fraction of cells expressing it, median expression, and per batch counts |
size.txt |
Size of input data (number of cells and genes) |
Gene expression distance is calculated for each batch, and results are not grouped, and are further used in bootstrap analysis.
Files |
Description |
|---|---|
dendrogram-heatmap-correlation-data.(h5/xlsx) |
For each gene holds all measurement data (e.g. cluster, Fraction, Top50 overlap, etc.). Contains correlation distance of expression measure. |
metricsFile.h5 |
Gene expression data for specified metric |
per-gene-measures-correlation.(h5/xlsx) |
Intra-measures from each gene |
perGeneStats.h5 |
For each gene holds fraction of cells expressing it, median expression, and per batch counts |
size.txt |
Size of input data (number of cells and genes) |
Contains files saved from Scramble function
Files |
Description |
|---|---|
combined_M_aligned.h5 |
Temporary file that holds distribution data; removed when analysis is completed. |
se_distribution.png |
Plotted counts distribution |
se_distribution.xlsx |
Counts distribution data |
Files
Files |
Description |
|---|---|
bootstrap_experiments_dendro_data.h5 |
Aggregation of all gene measurement data and correlation distance of expression measure for all bootstrap experiments |
data.h5 |
Output file from |
results.png |
Saved dendrogram, heatmap, and bargraphs, see example below |
For each combination of measurements (variant) of interest each of these files are outputted:
Files |
Description |
|---|---|
bootstrap_in-peak_genes_SD.xlsx |
Aggregation of all gene measurement data and correlation distance of expression measure for all bootstrap experiments |
variant.xlsx |
For each gene gives the percentage of bootstrap experiments in which it apppears in a peak along with mean, standard deviation, and covariance calculations. For each bootstrap experiment lists genes in the peak. |
variability.xlsx |
Holds mean, standard deviation, and covariance calculations |
Example of result figures using mouse PangLaoDB DCS-annotated endothelial cells